September 16, 2018
Dan Shainberg
While nobody can consistently or accurately predict the timing of market movements, we can analyze the causes and effects of material economic swings. If your estimates are even remotely accurate, then they should act like a grenade. Those who predicted the housing bust and invested in CDS made 10-15x their money, but as the movie "The Big Short" highlighted, there was pain for all those investors until their thesis eventually played out.
So where is the next recession going to hit? We'll ignore tying to time the exact moment of demise. Most recessions occur after certain warning signs. Like earthquakes, you can analyze historical patterns to predict the severity and a reasonable range of likelihood for the next "big one," but you cannot pinpoint the date of such an event.
Based on prior cycles, here are the signs to watch out for:
(1) Excess Sovereign Debt
Debt can be a very effective tool when used in moderation. It can add returns to your equity investments. As you add more debt, your return on equity (ROE) increases. If you pay $1 million for an asset such as a rental apartment, and that apartment generates $50,000 in annual income, then your return on investment (ROI) is equal to your return on equity (ROE) at 5%. If you borrow 80% to fund the purchase, then your net income will decline due to the interest expense associated with the borrowed capital. But your equity investment in the apartment drops from $1 million to $200,000. If your mortgage rate is 4%, then you must pay $32,000 to the lender. Net of tax benefits, your estimated net income should be around $30,000 instead of $50,000. But while your actual income dropped, your equity investment dropped by an even greater amount, so your return on equity goes up. While the ROI is still 5%, your ROE is now 15%. It is the $30,000 new income divided by your $200,000 equity investment. The problem is that you must pay the lender. If for whatever reason you cannot, and they foreclose, then you run the risk of losing your entire investment. That forced selling at any price, if compounded by others in a similar situation, is the common cause of a market crash. And as prices drop a social panic sets in where only the bravest value investors show up to casually pick off their favorite investments with little or no competitive bidders. So the leverage amplifies your return on your equity (ROE), but it also amplifies the risk. Any time you see excess leverage, you have the seeds for a nasty downturn.
Many countries today are highly levered. The most levered nations are in the emerging markets. Globally there is an estimated $8 trillion in sovereign date held in U.S. dollar denominated currency. So countries like Turkey which borrowed dollars, must pay it back in dollars. They cannot print Lira to inflate their way out of their leverage hole. Besides the growing debt balances, we are now seeing the U.S. dollar appreciate relative to most global currencies. This requires those foreign nations to have to pay more of their domestic currencies to fund their interest expense.
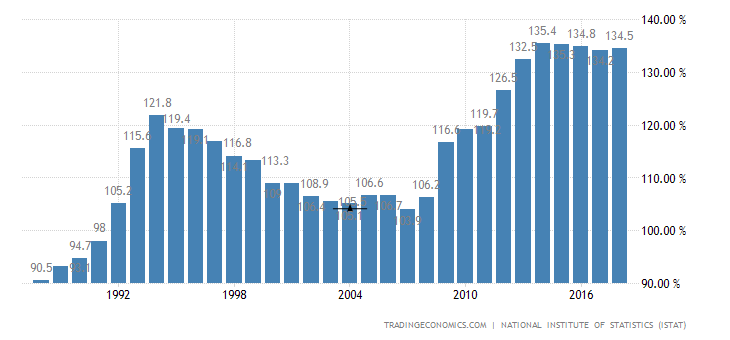
While Turkey may be insulated as a unique situation, Italy is in the European Union and has a debt/GDP ratio of 130%. Typically any country with over 100% debt to GDP is in big trouble. Given Italy's interconnected economy to the rest of Europe, a blowup in Rome could easily cause a nasty contagion effect whereby the ECB assumes their sovereign debt and imposes austerity or the Eurozone breaks apart. In either situation an economic crush would likely follow.
This chart shows the increase in leverage in Italy.

This chart by comparison shows the leverage in the United States which sits just above 100% debt/GDP. While extremely high, we at least can print our way out by inflating our currency relative to the debt which does not adjust to inflation. We can also use our military to invade other countries! But Italy has no options. And if you think Italy is just a small unimportant country on the world stage, consider this: Italy has the 3rd largest sovereign debt balance at $2.5 trillion.

(2) Excess Corporate Leverage
Private equity buyouts are an often cited metric to determine the economic cycle. When the economy is weak, capital is constrained. Private equity firms cannot raise funds, they cannot borrow to fund their leveraged transactions, and even if they could, it is mathematically tough to finance a deal with copious amounts of debt when most companies are seeing topline headwinds as you need the company's own cash flows to pay off the deal related debt and fund the interest due. As the economic cycle moves on, deal activity picks up. And when you enter the peak phase of the cycle, anyone with a Bloomberg can borrow, acquire and overpay for deals.
One of the most obvious signs of frothiness is the amount of senior debt versus high yield debt in the market. Typically senior debt in the corporate system is much larger than high yield debt. When companies and private equity investors are relaxed enough to lever up to acquire, that is typically a sign of frothiness. In a normal environment there is about 4-5x as much senior debt versus high yield. Today companies are issuing a similar amount of senior and high yield debt, a dangerous sign.
Dan Shainberg
#DanShainberg
#RecessionResister
@DanShainberg
#DanShainberg
#RecessionResister
@DanShainberg
No comments:
Post a Comment
Note: Only a member of this blog may post a comment.